
3.10 Construction of Fusion tables for visualization of potential migration paths of animals with aid of a Google Drive Database.
Horst Engels and Pedro Santos
Google Drive offers very good possibilities for construction of a (Personal) Database from documents stored in your Google Drive account. You have 15GB of free storage on one account, but if you use your 10 possible different accounts you can use up to 150GB of free storage space for your database. We are constructing at the moment a Database for collections of papers about Biodiversity on the Iberian Peninsula which can be accessed via a Google Drive Spreadsheet. The final database will also permit to build easily Google Fusion Tables in order to visualize the potential migration paths of species in the database.*
Construction of Fusion Tables for Species
Fusion tables permit visualization in Google Maps of points and lines which may form undirected or directed graphs. For the database we wish to show the potential migration paths for species based on their actual distribution.
A simple and semi-automated procedure to produce such graphs is as follows:
- The starting point is again the Google sheet “Biodiversity on the Iberian Peninsula (Parte II - Northern Portugal)”.
- In the case of the Mammals worksheet, you need the following columns for the construction of the Fusion table from the database:
Mamíferos (Mammalia)
|
Sítio/Nome
|
Longitude (DD)
|
Latitude (DD)
|
Each record must hold at least a location of occurrence for the selected species stored as geographic coordinates (Longitude and Latitude), both in decimal degrees.
- You select the records of the species whose potential migration paths you wish to construct by applying a filter query, for example on the species Galemys pyrenaicus. The result of the query is saved as a Filter view (-->;Data-->;Filter views...-->;Save as Filter view).
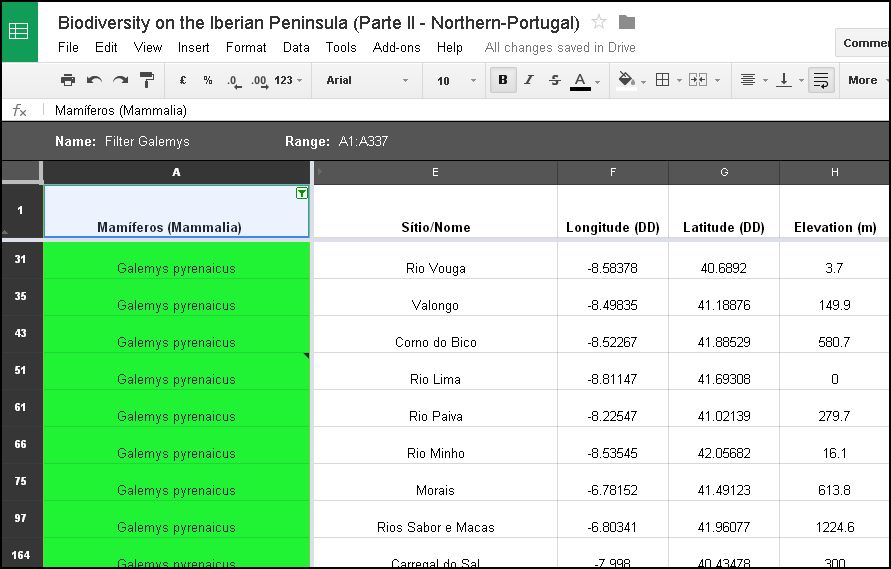
- Now you move the record which contains the principal node of interest for migration (this might be Serra da Estrela for example) to the top of the list. It is important to do this only in a Filter view, otherwise the database will be permanently altered!

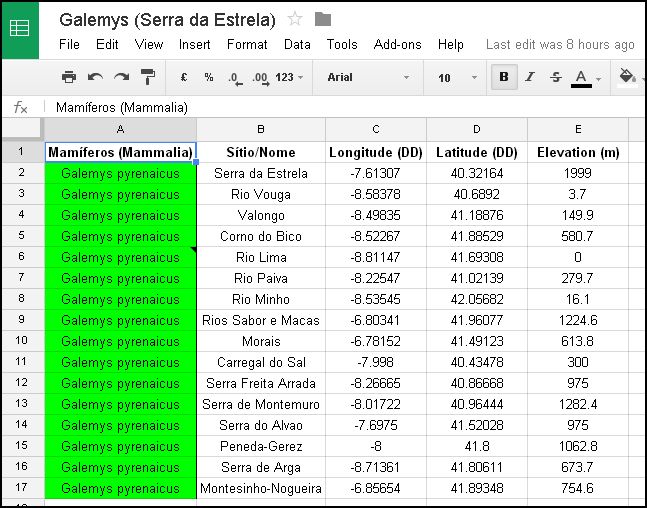
- In a third step you copy this (reordered) selection into a new table which you may name something like “Galemys (Location of interest)”. If you only wish to display points of occurrence of the species you can skip step (4) of reordering the records and will go ahead to step (10).
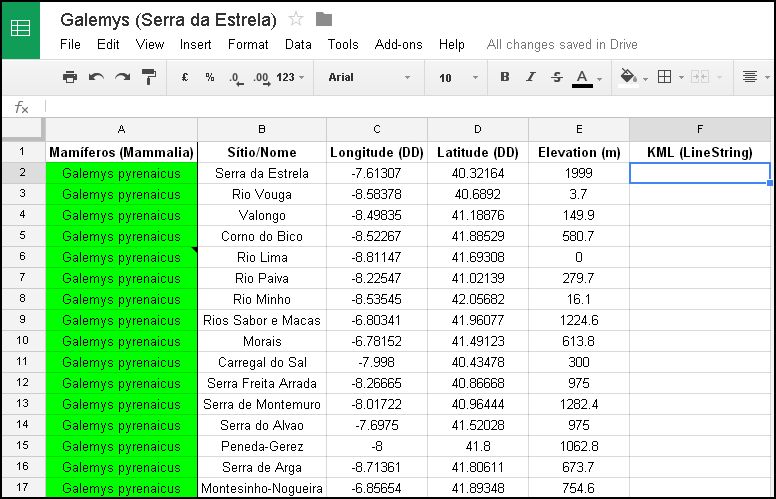
- In this table you create a column which you may call “KML (LineString)” and which will hold LineString-KMLs (edges) for the graph which you want to map in the Fusion table.
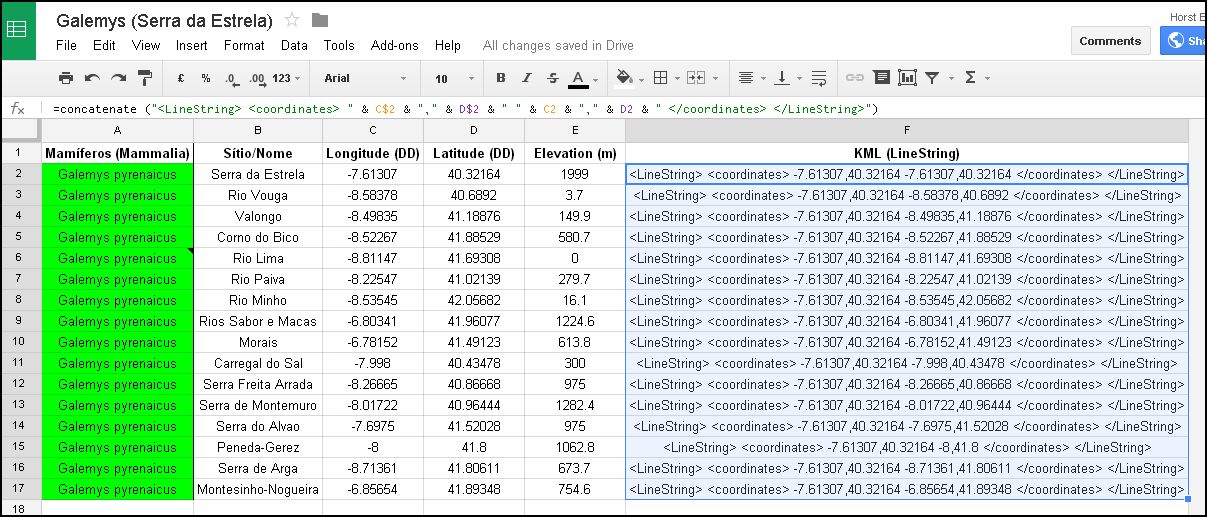
- Now you paste a formula into the first cell (F2) of the new column which produces the KML for a lines between the 1. (Serra da Estrela) and ith. node from the geographic coordinates of the node coordinates in column C and D. In this case the formula which will be pasted into cell F2 looks like this:
 |
(C$2and D$2 hold the geographic coordinates (in decimal degrees) of the Serra da Estrela node - C$2 and D$2 are absolute (not relative) positions in the spreadsheet.)
- Copying this formula into the other cells of column F (in the example cells F3 to F17), the KMLs for the restant lines, formed by the node pairs (Serra da Estrela - Location of the ith record), are generated.
Now the table should look like this:
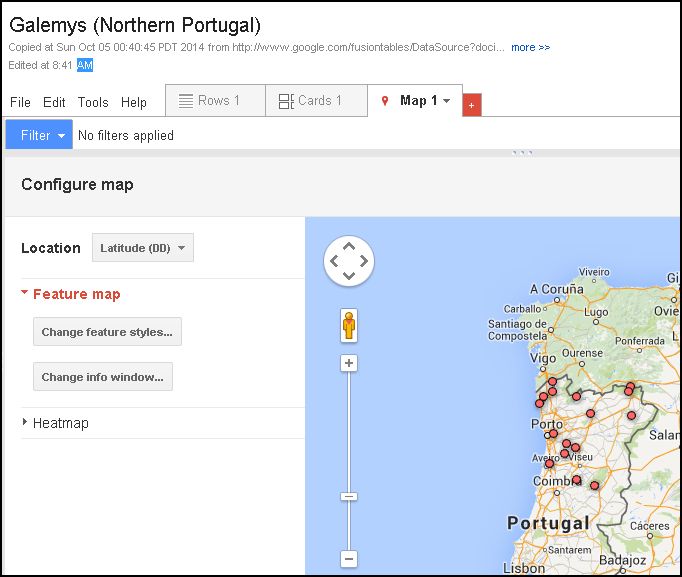
- In the last step the Fusion table is created from this base table. This is a straightforward process as the column which holds the KMLs for the LineStrings, is automatically recognized as the location field in the Fusion table. The final result is shown here:

Potential migration paths for Galemys pyrenaicus into or from Serra da Estrela
into or from protected sites in North Portugal
(Link to the Fusion table - Galemys (Serra da Estrela))
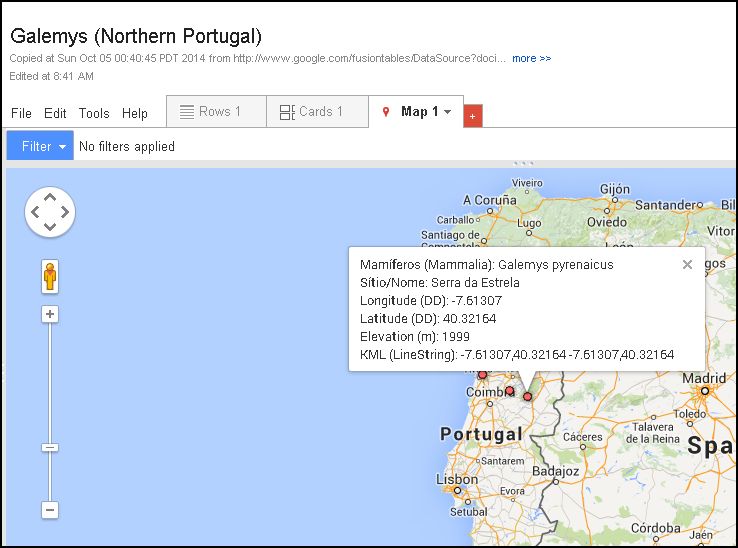
- In case that you wish to display only locations of occurrence of the species in a map you can use the table from step (4) and import the table into a Fusion table where you set the two columns with latitude - longitude coordinates as the locations. The following map can be displayed now of occurrence of Galemys pyrenaicus in protected sites in Northern Portugal:
*It
must be stressed out here that the simple graphs shown in this post can
give only a rudimentary idea of the potential migration paths - as
spatial conditions as topography, ambient conditions and species
specific requirements are not taken into consideration in the straight
line graph (- fish unlikely fly on a straight line from one location to
another). But also, at the moment the necessary data for estimation of
acceptable migration paths (with or without more sophisticated methods
and programs as the program “Maxent”) are not existent or unavailable
(at least not public or free). Furthermore, even much more elaborate
methods as “Maximum entropy” estimation are always bound to use positive information about presence of species. Therefore, absence of species
which might be true absence or only lack of confirmation, cannot be taken adequately into consideration. If information of
presence of species is not available due to a largely unknown
distribution of the species, as is the case for many or most of the
smaller and less “attractive” species (on the Iberian Peninsula and
worldwide), no good estimation of potential migration paths can be made
whatsoever. Other reasons may be lack of attention to endangered species
which are not categorized as in danger because of a lack of data
actualization (as for example due to climate changes).
Therefore the principal purpose of the database is besides collection of papers to show whether a species exists in protected locations and whether migration and/or reintroduction from nearby and hopefully genetically similar and well adapted populations is possible when the species becomes locally endangered or extinct. The second objective is to show (and fill in future) still existing big gaps of information, especially for the less known categories and species rich systematic groups as Invertebrates, lichens and bryophytes. The graph method with aid of Fusion tables is at the moment a by-product which can be however very useful for visualization of relations between locations or species.